Columbia
Observatory history
We established the Columbia River Observatory with the help of Richard Collins in Vancouver, Washington in August of 2015. Since then, Richard has been sampling the river from the northern bank roughly once a month. He is using our volunteer sampling kits to filter river water through 0.22 micrometer cartridge filters into clean sampling bottles. After each sampling, a 20 ml sampling bottle is frozen for nutrient analyses at the Woods Hole Oceanographic Institution. Freezing is important, as microbes would otherwise continue to chew on the nutrients and change their concentrations. The nutrient analyses give us insights into the pollution from fertilizers applied to agricultural areas in the Columbia River drainage basin, and into pollution from human and animal waste. Another 20 ml bottle, filled to the top, is used to analyze the stable water isotope composition of the water. These analyses tell us where within the drainage basin the water in the river is coming from. For instance, the isotope composition of water from the Rocky Mountains has a different signature than water from the low-lands. Storage of water in the many reservoirs modifies the isotope signature of water in predictable ways. These analyses are carried out by the Isotope Hydrology Laboratory at the International Atomic Energy Agency in Vienna (IAEA), Austria. A 125 ml bottle of water is used to determine the major and trace constituents in the river water, such as chloride, sulphate, calcium, magnesium, sodium and potassium. We also use these bottles from time to time to measure other properties that we do not analyze routinely. What we do not use we store in a refrigerator for later use.
The Columbia River interests us for several reasons. First, it is the sister basin to the Fraser River that is located just to the north. Our Fraser River Observatory has been active since the summer of 2009, and comparing the two basins gives us insights into how humans have modified both rivers. For instance, the Fraser River is free-flowing without a single dam on its main stem. We have to thank the Salmon for saving the Fraser River. In contrast, the Columbia River has been sacrificed for hydroelectric energy production and many large reservoirs interrupt short stretches of free-flowing river. Secondly, the Columbia River is the third largest river basin in the lower 48 US states (after the Mississippi and the Colorado river basins), and we compare its composition to that of the Mississippi River that borders the basin on its eastern and southeastern side. Compared to the Columbia River the Mississippi River is more heavily contaminated with excess nutrients from the fertile agricultural areas, population centers and industry in the Mississippi River basin. Below are some statistics on the Columbia River watershed, and a beautiful cloud-free map of the entire basin that senior geospatial analyst Greg Fiske (WHRC) stitched together from many individual images.
Watershed statistics
- Countries: USA, Canada
- Large-scale drainage area: western North America (Pacific)
- Drainage: 657,490 sq km
- Water discharge: 236 km3/yr
- Suspended sediment transport: 12 Mt/yr
- Population density: 9 people/km2
- Large cities: 5
- Cropland: 6%
- Cropland irrigated: 40%
- Developed: 9%
- Forest: 49%
- Loss of original forest: 22%
- Shrub: 22%
- Grassland: 14%
- Eroded area: 5%
- Large dams: 184 (visible in dark blue in the image below)
Reference: Revenga, C., S. Murray, J. Abramovitz, and A. Hammond, 1998. Watersheds of the World: Ecological Value and Vulnerability. Washington, DC: World Resources Institute.
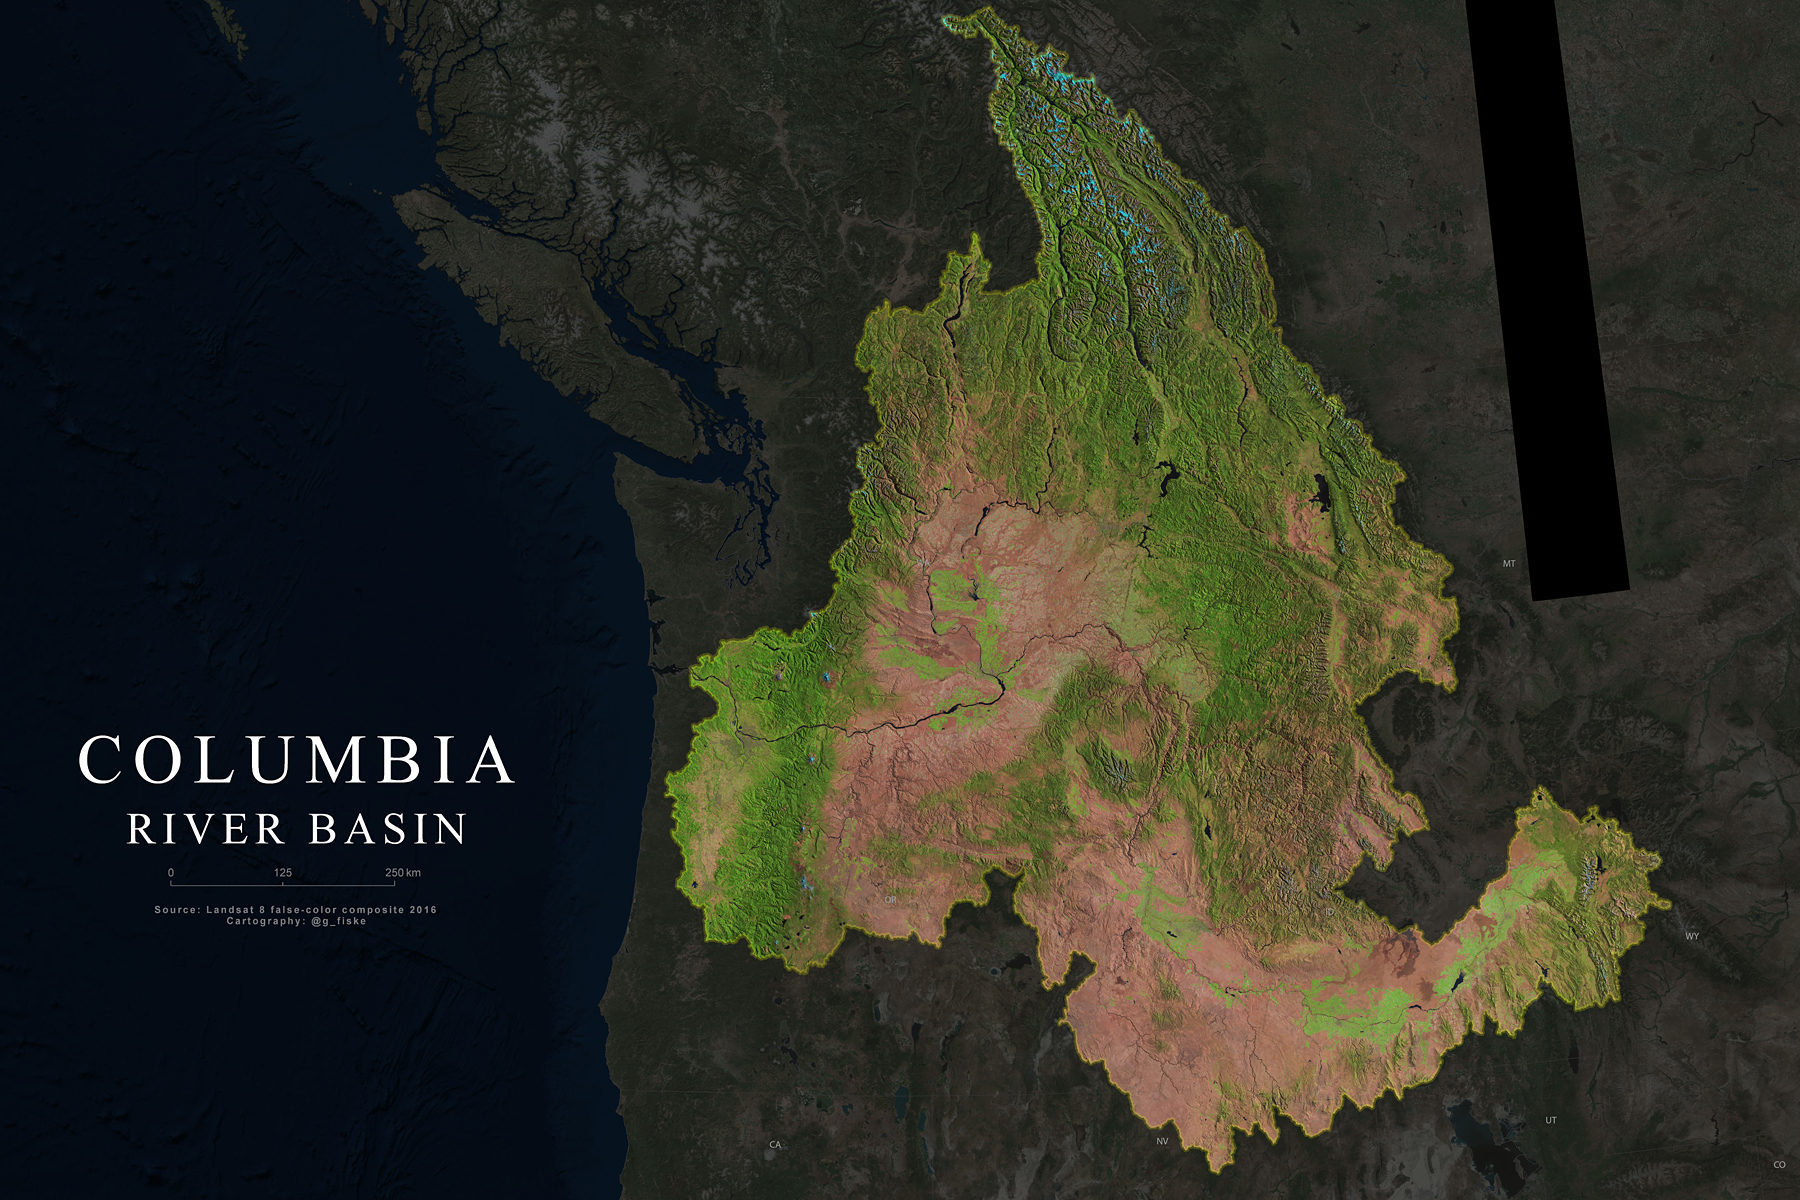
Columbia River basin, mapped by Greg Fiske (WHRC)